Weekly Market Commentary
May 5th, 2025
Week in Review…
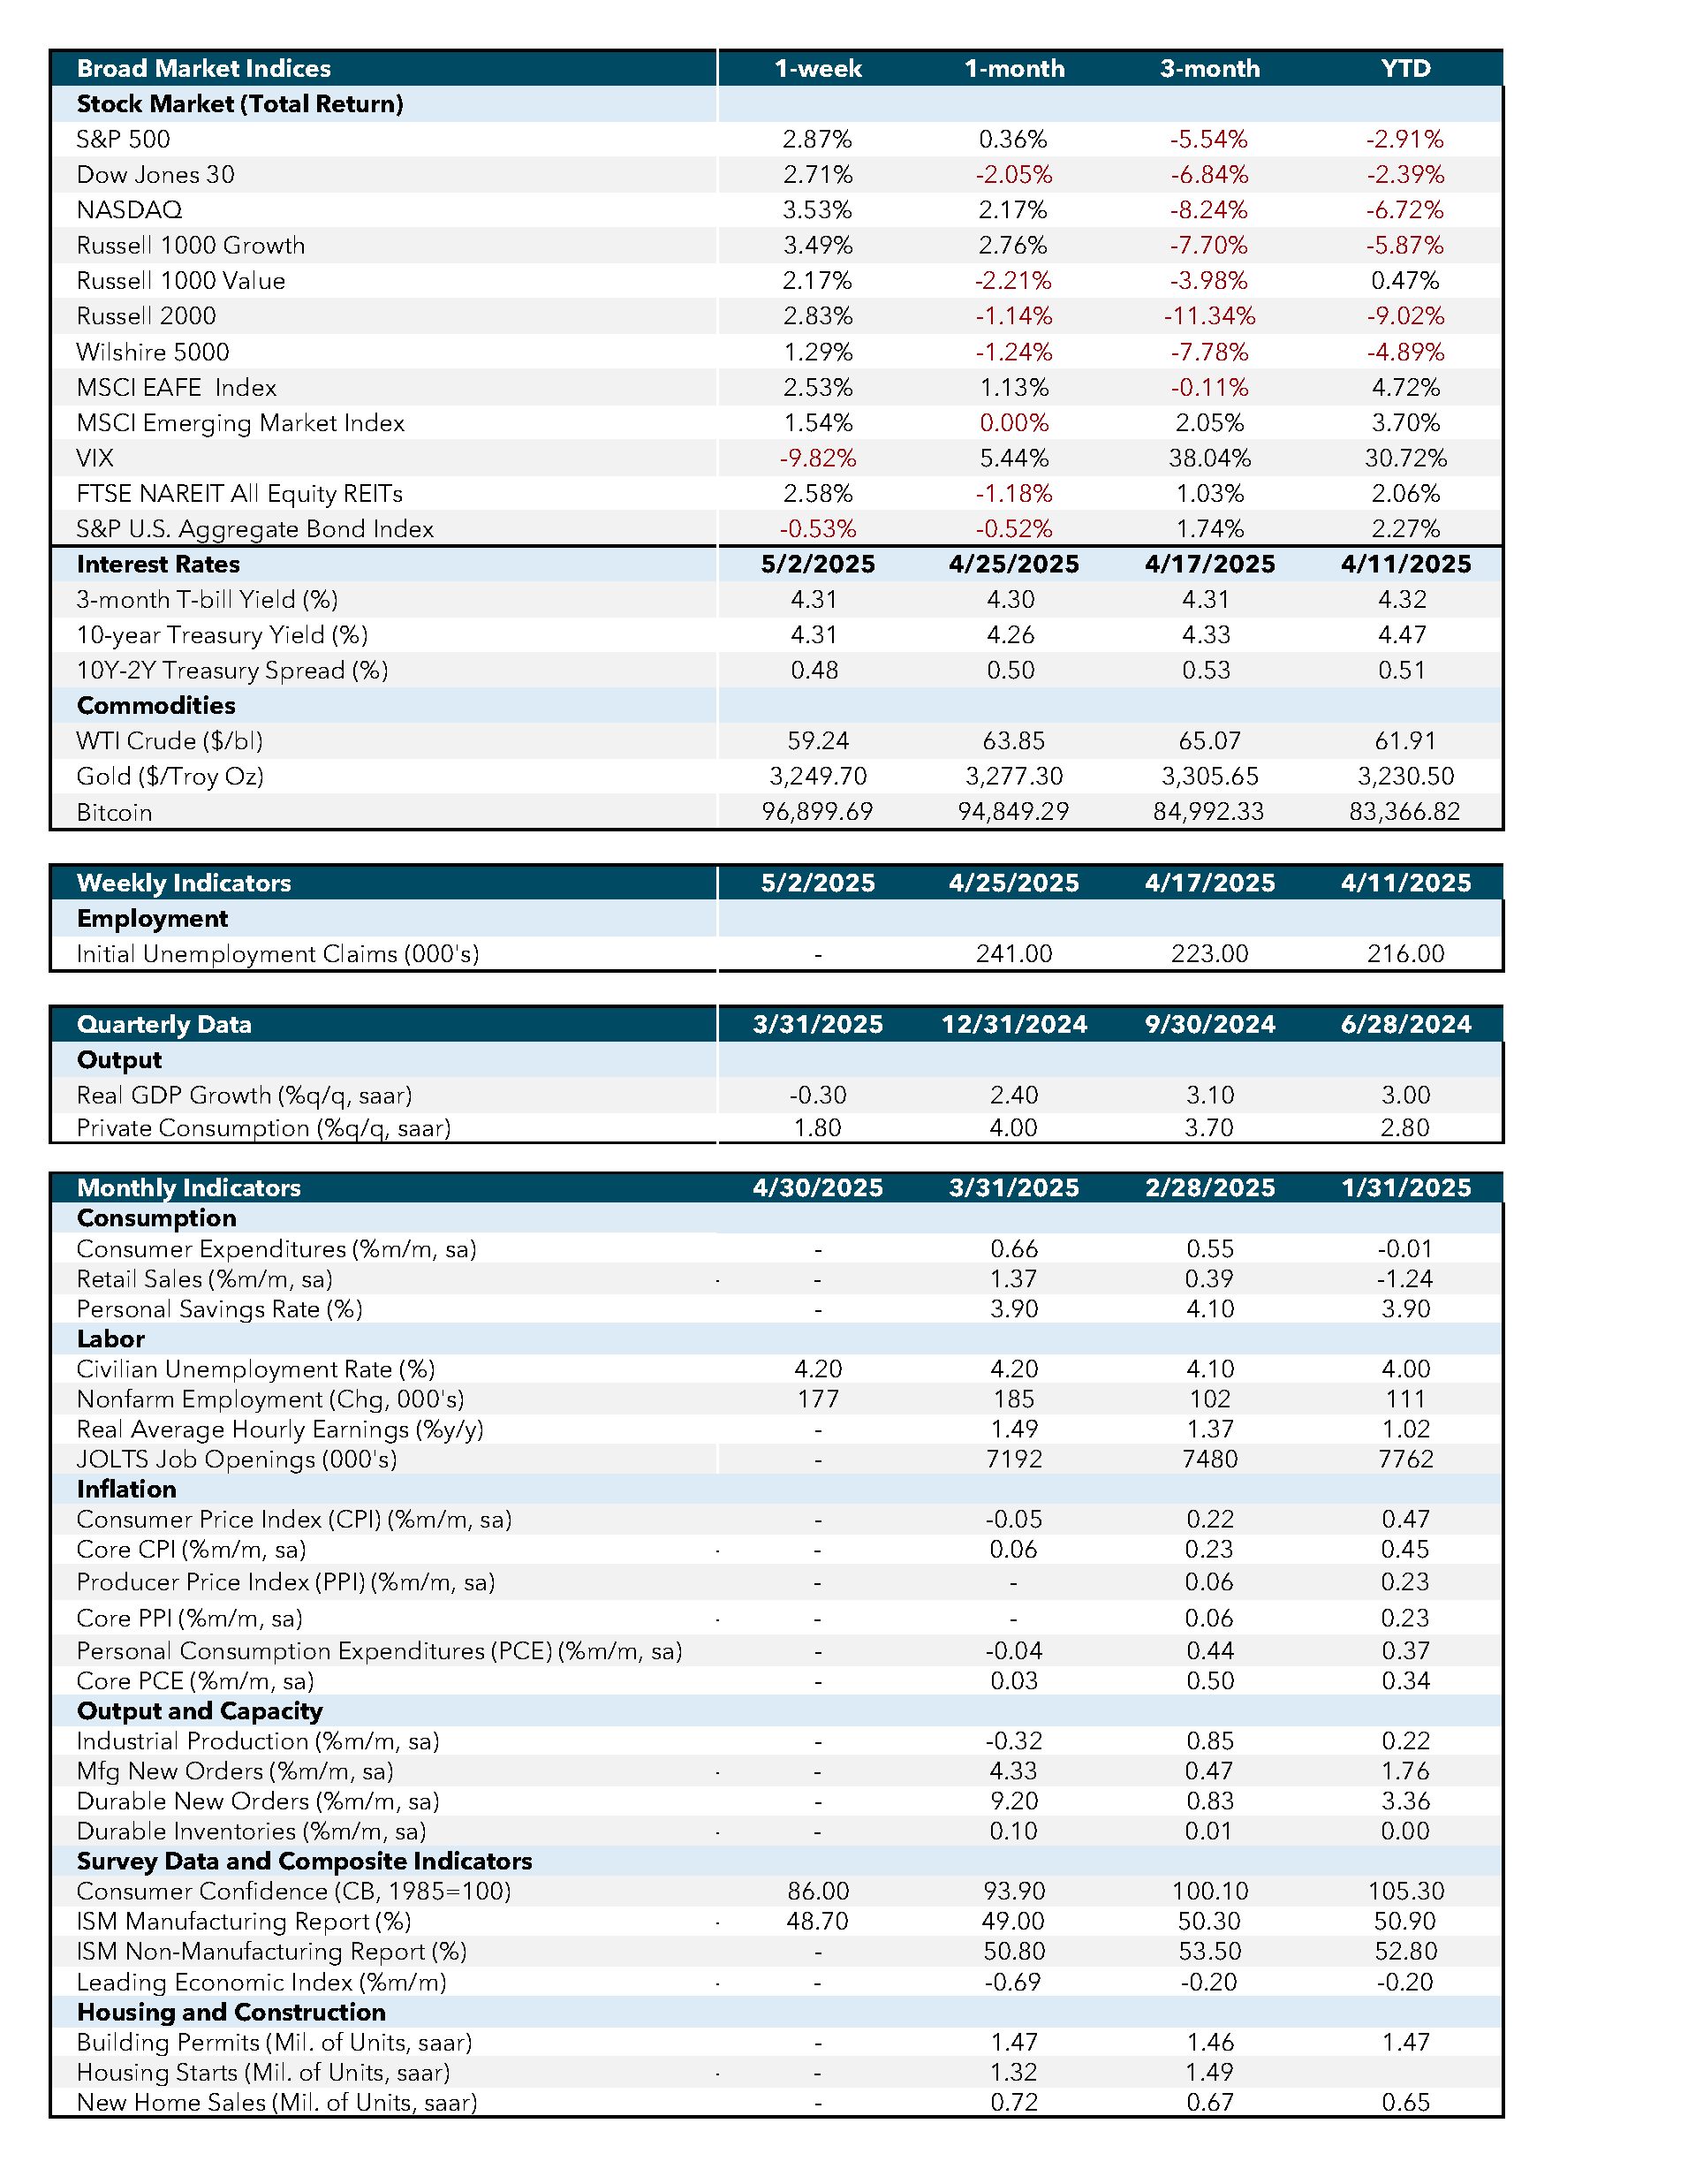
Last week brought a series of economic indicators that painted a cautious picture of the current economic landscape. On Monday, the Conference Board reported a notable drop in the Consumer Confidence Index for April, which fell by 7.9 points to 86.0 — the lowest level since May 2020. This marked the fifth consecutive monthly decline, underscoring mounting pessimism about future business conditions, employment prospects, and income levels. Also on Monday, the Bureau of Labor Statistics (BLS) released its Job Openings and Labor Turnover Survey (JOLTS) for March, showing job openings held steady at 7.2 million but were down by 901,000 from a year earlier. The stability in job openings and hires, coupled with an unchanged quit rate, pointed to a cooling labor market and heightened caution among workers.
On Tuesday, the Bureau of Economic Analysis published its advance estimate for first-quarter 2025 GDP, which signaled a contraction at an annualized rate of 0.3%. This decline was largely driven by a surge in imports and reduced government spending, reflecting softer consumer demand and tighter fiscal policy. Meanwhile, the Personal Consumption Expenditures (PCE) price index rose by 3.6% in the first quarter, up from 2.4% in the prior quarter, highlighting renewed inflationary pressures and further clouding the economic outlook.
By Thursday, the BLS reported that nonfarm payroll employment had increased by 177,000 jobs in April, while the unemployment rate held steady at 4.2%. In the markets, a generally bullish tone prevailed, buoyed by tentative signs of easing tariff tensions and optimism about potential progress in trade negotiations.
Taken together, these indicators suggest a U.S. economy facing headwinds from both softening consumer sentiment and persistent inflation, with the labor market showing early signs of moderation.
On Wednesday, the Institute for Supply Management (ISM) reported that the Manufacturing Purchasing Managers’ Index (PMI) for March 2025 was 49.5, indicating a slight contraction due to challenges in new orders and production. This follows marginal expansions in February and January after 26 months of contraction. Demand and output weakened, while input costs rose, negatively impacting economic growth. In contrast, the Services PMI showed strong growth with a reading of 56.3, driven by increased business activity.
On Thursday, durable goods orders saw a significant rise, particularly in the aerospace sector, though other areas remained subdued due to economic uncertainties stemming from tariffs. Friday’s final April Michigan Consumer Sentiment was revised upward from the initial print, reflecting better current and future expectations, although it remained at the lowest level since July 2022.
Economic and Capital Markets Dashboard
Week Ahead…

This week’s economic calendar is relatively light, but a few key reports will offer valuable insights into the state of the economy. Highlights include the April ISM Services Index, the March U.S. trade balance, weekly jobless claims, and Q1 productivity figures.
Monday brings the release of the ISM Manufacturing and Services Purchasing Managers’ Index (PMI) data. These indices serve as important barometers for the health of both the manufacturing and service sectors. By tracking activity levels, the data will provide a snapshot of how these sectors are performing, as well as their potential impact on overall economic growth.
Wednesday will be a pivotal day as the Federal Reserve announces its latest interest rate decision. This meeting takes place against a backdrop of heightened uncertainty, particularly in light of recently imposed tariffs. Market participants will be closely watching the Fed’s policy stance to gauge whether interest rates will remain steady or be adjusted in response to these economic headwinds. The Fed’s decision is especially significant, as it will influence borrowing costs, consumer spending, and overall economic activity, shaping the trajectory of the economy amid ongoing tariff-related challenges.
Economic Indicators:
- CPI: Consumer Price Index measures the average change in prices paid by consumers for goods and services over time. Source: Bureau of Labor Statistics.
- Core CPI: Core Consumer Price Index excludes food and energy prices to provide a clearer picture of long-term inflation trends. Source: Bureau of Labor Statistics.
- PPI: Producer Price Index measures the average change in selling prices received by domestic producers for their output. Source: Bureau of Labor Statistics.
- Core PPI: Core Producer Price Index excludes food and energy prices to provide a clearer picture of long-term inflation trends. Source: Bureau of Labor Statistics.
- PCE: Personal Consumption Expenditures measure the average change in prices paid by consumers for goods and services. Source: Bureau of Economic Analysis.
- Core PCE: Core Personal Consumption Expenditures exclude food and energy prices to provide a clearer picture of long-term inflation trends. Source: Bureau of Economic Analysis.
- Industrial Production: Measures the output of the industrial sector, including manufacturing, mining, and utilities. Source: Federal Reserve.
- Mfg New Orders: Measures the value of new orders placed with manufacturers for durable and non-durable goods. Source: Census Bureau.
- Durable New Orders: Measures the value of new orders placed with manufacturers of durable goods. Source: Census Bureau.
- Durable Inventories: Measures the value of inventories held by manufacturers for durable goods. Source: Census Bureau.
- Consumer Confidence (CB, 1985=100): Measures the degree of optimism that consumers feel about the overall state of the economy and their personal financial situation. Source: Conference Board.
- ISM Manufacturing Report: Measures the economic health of the manufacturing sector based on surveys of purchasing managers. Source: Institute for Supply Management.
- ISM Non-Manufacturing Report: Measures the economic health of the non-manufacturing sector based on surveys of purchasing managers. Source: Institute for Supply Management.
- Leading Economic Index: Measures overall economic activity and predicts future economic trends. Source: Conference Board.
- Building Permits (Mil. of Units, saar): Measures the number of new residential building permits issued. Source: Census Bureau.
- Housing Starts (Mil. of Units, saar): Measures the number of new residential construction projects that have begun. Source: Census Bureau.
- New Home Sales (Mil. of Units, saar): Measures the number of newly constructed homes sold. Source: Census Bureau.
- SA: Seasonally adjusted.
- SAAR: Seasonally adjusted annual rate.
Market Indices & Indicators:
- S&P 500: A market-capitalization-weighted index of 500 leading publicly traded companies in the U.S., widely regarded as one of the best gauges of large U.S. stocks and the stock market overall.
- Dow Jones 30: Also known as the Dow Jones Industrial Average, it tracks the share price performance of 30 large, publicly traded U.S. companies, serving as a barometer of the stock market and economy.
- NASDAQ: The world’s first electronic stock exchange, primarily listing technology giants and operating 29 markets globally.
- Russell 1000 Growth: Measures the performance of large-cap growth segment of the U.S. equity universe, including companies with higher price-to-book ratios and growth metrics.
- Russell 1000 Value: Measures the performance of large-cap value segment of the U.S. equity universe, including companies with lower price-to-book ratios and growth metrics.
- Russell 2000: A market index composed of 2,000 small-cap companies, widely used as a benchmark for small-cap mutual funds.
- Wilshire 5000: A market-capitalization-weighted index capturing the performance of all American stocks actively traded in the U.S., representing the broadest measure of the U.S. stock market.
- MSCI EAFE Index: An equity index capturing large and mid-cap representation across developed markets countries around the world, excluding the U.S. and Canada.
- MSCI Emerging Market Index: Captures large and mid-cap representation across emerging markets countries, covering approximately 85% of the free float-adjusted market capitalization in each country.
- VIX: The CBOE Volatility Index measures the market’s expectations for volatility over the coming 30 days, often referred to as the “fear gauge.”
- FTSE NAREIT All Equity REITs: Measures the performance of all publicly traded equity real estate investment trusts (REITs) listed in the U.S., excluding mortgage REITs.
- S&P U.S. Aggregate Bond Index: Represents the performance of the U.S. investment-grade bond market, including government, corporate, mortgage-backed, and asset-backed securities.
- 3-Month T-bill Yield (%): The yield on U.S. Treasury bills with a maturity of three months, reflecting short-term interest rates.
- 10-Year Treasury Yield (%): The yield on U.S. Treasury bonds with a maturity of ten years, reflecting long-term interest rates.
- 10Y-2Y Treasury Spread (%): The difference between the yields on 10-year and 2-year U.S. Treasury bonds, often used as an indicator of economic expectations.
- WTI Crude ($/bl): The price per barrel of West Texas Intermediate crude oil, a benchmark for U.S. oil prices.
- Gold ($/Troy Oz): The price per troy ounce of gold, a standard measure for gold prices.
- Bitcoin: A decentralized digital currency without a central bank or single administrator, which can be sent from user to user on the peer-to-peer bitcoin network.
This content was developed by Cambridge from sources believed to be reliable. This content is provided for informational purposes only and should not be construed or acted upon as individualized investment advice. It should not be considered a recommendation or solicitation. Information is subject to change. Any forward-looking statements are based on assumptions, may not materialize, and are subject to revision without notice. The information in this material is not intended as tax or legal advice.
Investing involves risk. Depending on the different types of investments there may be varying degrees of risk. Socially responsible investing does not guarantee any amount of success. Clients and prospective clients should be prepared to bear investment loss including loss of original principal. Indices mentioned are unmanaged and cannot be invested into directly. Past performance is not a guarantee of future results.
The Dow Jones Industrial Average (DJIA) is a price-weighted index composed of 30 widely traded blue-chip U.S. common stocks. The S&P 500 is a market-cap weighted index composed of the common stocks of 500 leading companies in leading industries of the U.S. economy. The NASDAQ Composite Index is a market-value weighted index of all common stocks listed on the NASDAQ stock exchange.
Securities offered through Cambridge Investment Research, Inc., a broker-dealer, member FINRA/SIPC, and investment advisory services offered through Cambridge Investment Research Advisors, Inc., a Registered Investment Adviser. Both are wholly-owned subsidiaries of Cambridge Investment Group, Inc. V.CIR.0525-1784